n <- 1000
m <- 5
dof <- m - 1
chisq <- rchisq(n, dof)
h <- hist(chisq, breaks = 100, plot = FALSE)
h$counts <- h$counts / sum(h$counts)
plot(h, ylab = "relative frequency", axes = FALSE)
axis(1)
axis(2)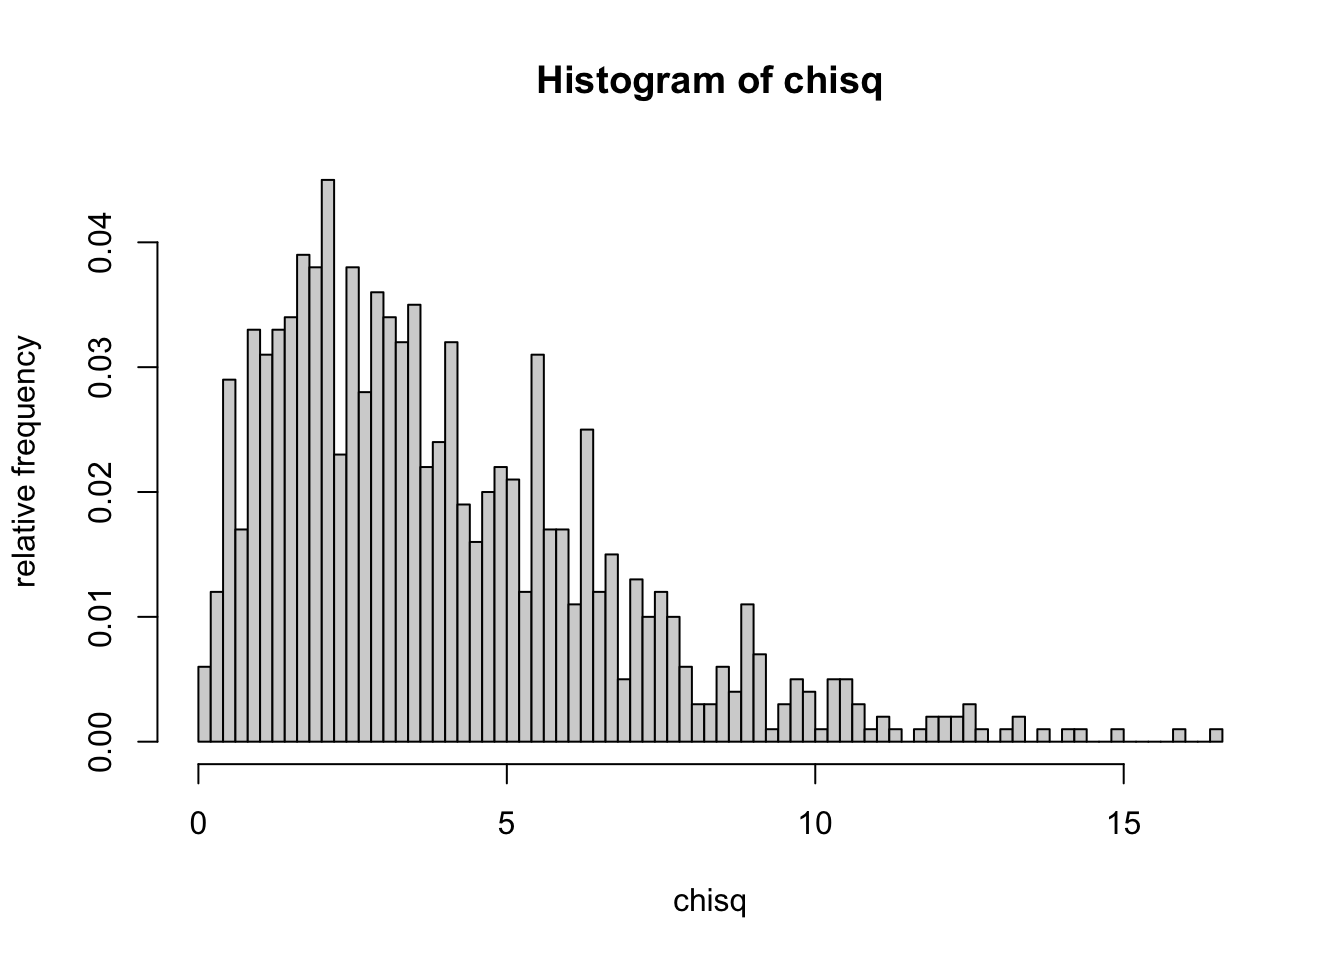
hist()は折れ線を描く函数だが、plot = FALSEで統計のみにする。 頻度を総数で割り、相対頻度にしてplot()で描画する。
n <- 1000
m <- 5
dof <- m - 1
chisq <- rchisq(n, dof)
h <- hist(chisq, breaks = 100, plot = FALSE)
h$counts <- h$counts / sum(h$counts)
plot(h, ylab = "relative frequency", axes = FALSE)
axis(1)
axis(2)