人が感じる色は赤と緑、黄色と青の二軸で表すのが自然とされている(Ihaka 2003 ) 。 これを極座標で表したときの角度が色調(hue)、動径が彩度(chroma)である。 さらに輝度(luminance)を加えた円筒座標をHCL色空間という。 Rの既定の色空間はHCLである。
知覚に関する色の選択として次のような条件が挙げられる(Ihaka 2003 ) 。
グラフの広い領域に高い彩度を使うことは避ける。注意が長く続き、残像により注意をそらす可能性があるためである。
グラフで面積が重要なら、近い彩度の色を使う。明るい色は暗い色よりも、面積を大きく見えるためである。
色をグループに属することを表すなら、色は見分けやすくすべきである。
これらの条件を満たす簡単な方法は、HCLを使うことである。 その方法は、知覚の上で一様な色空間で、輝度と彩度を同じに、色調を等間隔にするというものである。
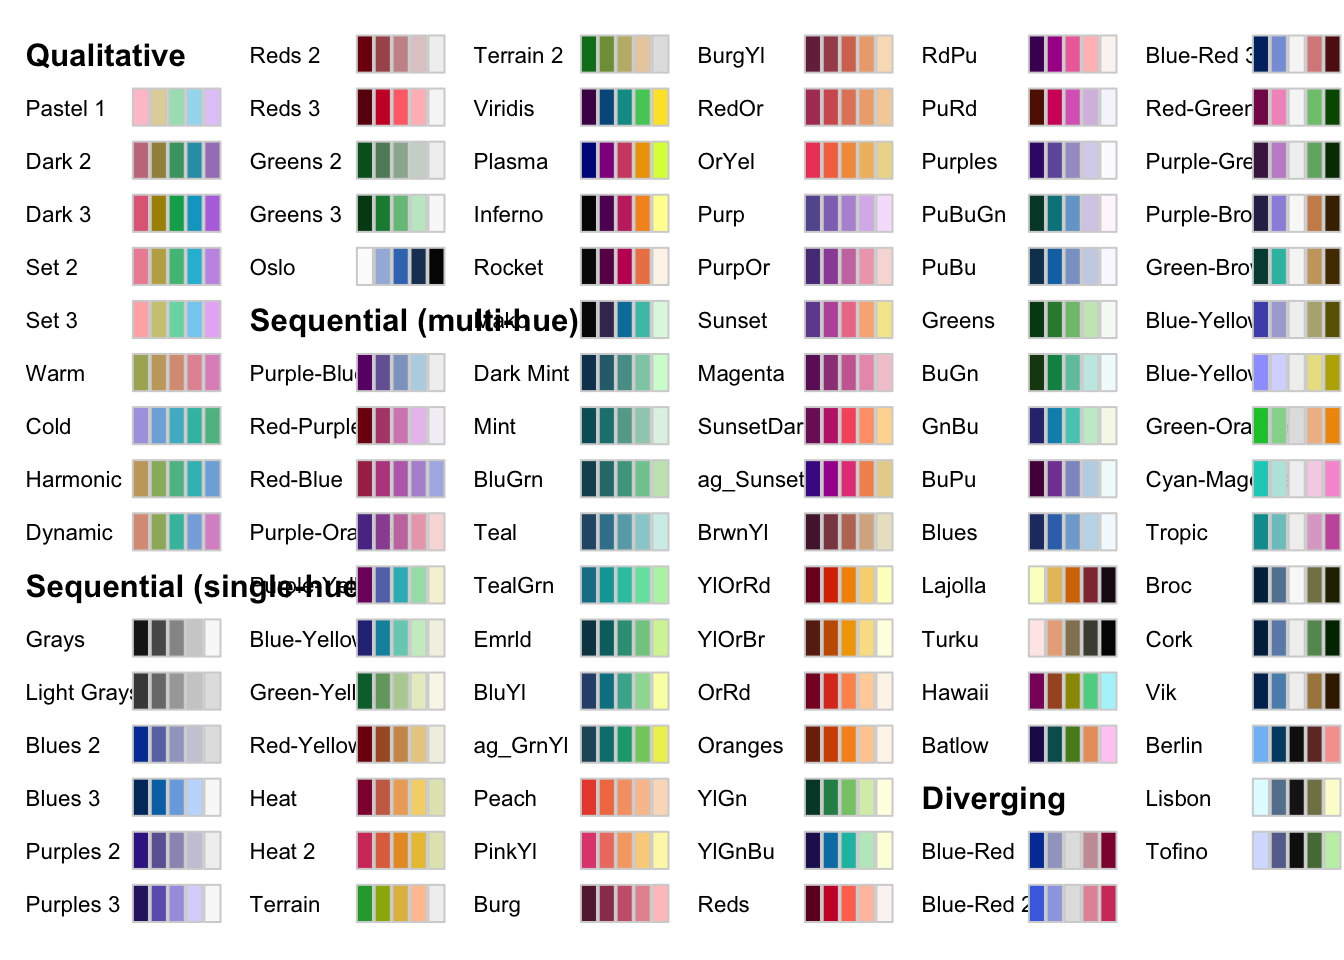
hcl.pals()でパレットの名前の一覧を表示できる。
  [1] "Pastel 1"      "Dark 2"        "Dark 3"        "Set 2"
  [5] "Set 3"         "Warm"          "Cold"          "Harmonic"
  [9] "Dynamic"       "Grays"         "Light Grays"   "Blues 2"
 [13] "Blues 3"       "Purples 2"     "Purples 3"     "Reds 2"
 [17] "Reds 3"        "Greens 2"      "Greens 3"      "Oslo"
 [21] "Purple-Blue"   "Red-Purple"    "Red-Blue"      "Purple-Orange"
 [25] "Purple-Yellow" "Blue-Yellow"   "Green-Yellow"  "Red-Yellow"
 [29] "Heat"          "Heat 2"        "Terrain"       "Terrain 2"
 [33] "Viridis"       "Plasma"        "Inferno"       "Rocket"
 [37] "Mako"          "Dark Mint"     "Mint"          "BluGrn"
 [41] "Teal"          "TealGrn"       "Emrld"         "BluYl"
 [45] "ag_GrnYl"      "Peach"         "PinkYl"        "Burg"
 [49] "BurgYl"        "RedOr"         "OrYel"         "Purp"
 [53] "PurpOr"        "Sunset"        "Magenta"       "SunsetDark"
 [57] "ag_Sunset"     "BrwnYl"        "YlOrRd"        "YlOrBr"
 [61] "OrRd"          "Oranges"       "YlGn"          "YlGnBu"
 [65] "Reds"          "RdPu"          "PuRd"          "Purples"
 [69] "PuBuGn"        "PuBu"          "Greens"        "BuGn"
 [73] "GnBu"          "BuPu"          "Blues"         "Lajolla"
 [77] "Turku"         "Hawaii"        "Batlow"        "Blue-Red"
 [81] "Blue-Red 2"    "Blue-Red 3"    "Red-Green"     "Purple-Green"
 [85] "Purple-Brown"  "Green-Brown"   "Blue-Yellow 2" "Blue-Yellow 3"
 [89] "Green-Orange"  "Cyan-Magenta"  "Tropic"        "Broc"
 [93] "Cork"          "Vik"           "Berlin"        "Lisbon"
 [97] "Tofino"        "ArmyRose"      "Earth"         "Fall"
[101] "Geyser"        "TealRose"      "Temps"         "PuOr"
[105] "RdBu"          "RdGy"          "PiYG"          "PRGn"
[109] "BrBG"          "RdYlBu"        "RdYlGn"        "Spectral"
[113] "Zissou 1"      "Cividis"       "Roma"
既定はviridisである。 hcl.pals()の引数に文字列で名前を渡すと、パレットが変わる。
hcl.colors()に色の数を渡すと、16進数でRGBの文字列ベクトルが返される。
[1] "#4B0055" "#00588B" "#009B95" "#53CC67" "#FDE333"
colorspace を使うと、パレットを描画できる。(Zeileis et al. 2020 )
library (colorspace)hcl_palettes (plot = TRUE )
References
Ihaka, R., 2003: Colour for
Presentation Graphics .
Proc. 3rd International Workshop on Distributed Statistical Computing , Vienna, Austria
https://www.r-project.org/conferences/DSC-2003/Proceedings/Ihaka.pdf .
Zeileis, A., J. C. Fisher, K. Hornik, R. Ihaka, C. D. McWhite, P. Murrell, R. Stauffer, and C. O. Wilke, 2020: Colorspace:
A toolbox for manipulating and assessing colors and palettes.
J. Stat. Software ,
96 ,
https://doi.org/10.18637/jss.v096.i01 .